
More Information
Submitted: March 13, 2024 | Approved: March 22, 2024 | Published: March 25, 2024
How to cite this article: Kondo S, Yoshinori W. Social Implementation and Measurement Accuracy Verification of Non-contact Biological Monitors. Clin J Nurs Care Pract. 2024; 8: 011-021.
DOI: 10.29328/journal.cjncp.1001052
Copyright License: © 2024 Kondo S, et al. This is an open access article distributed under the Creative Commons Attribution License, which permits unrestricted use, distribution, and reproduction in any medium, provided the original work is properly cited.
Keywords: Radar sensor; Non-contact monitor; Deep plethysmogram; Central blood pressure; Telemedicine; Deterioration of the condition; Sudden death; Home medical treatment; Prehospital diagnosis; Home care
Abbreviations: Pharmaceutically approved product (μBP-mp); Prototype non-contact monitor (NBC-1100); Correlation coefficient (r); Blood pressure value (mmHg); Pulse rate; Respiratory rate (bpm) significance level (%)

Social Implementation and Measurement Accuracy Verification of Non-contact Biological Monitors
Shinji Kondo1,2* and Wakita Yoshinori1
1K&S Co., Ltd, Japan
2Department of General Practice Medicine, Aichi Medical University School of Medicine, Japan
*Address for Correspondence: Shinji Kondo, K&S Co., Ltd, 93-3 Nakamaedalgaya-cho, Kariya City, Aichi Japan, Email: [email protected]
In this research, for the purpose of social implementation, we conducted a near-miss demonstration experiment using a car driving in the city and a drive-simulator. Next, we conducted a demonstration experiment to evaluate the reliability of biometric information measured on patients in a medical facility's recuperation ward and residents of a special nursing home. NBC-1100 emits radar waves from a distance of up to 3 meters from an object and uses the reflected waves to measure biological information such as pulse waves and breathing waves.
The multi-element pyroelectric effect was used to measure body temperature by detecting infrared radiation emitted from distant objects. This device is unique in that it can measure biological information without being restrained while wearing clothes.
In the demonstration test, simultaneous measurements were conducted on nine healthy men aged 45 to 65 using a pharmaceutically approved product (μBP-mp) and a prototype non-contact biological monitor (NBC-1100 manufactured by K&S Co., Ltd.).
The demonstration experiments at medical institutions and nursing care facilities were conducted with the consent of residents and their families and were conducted on 30 men and women between the ages of 70 and 94 who were undergoing treatment or in need of care.
The tests were conducted on residents with chronic diseases such as dilated gastrostomies, symptomatic epilepsy, hypertension, Alzheimer's disease, and progressive supranuclear palsy. The evaluation method was simultaneous measurement using a master meter (μBP-mp) and a test meter (NBC-1100).
In Japan, the baby boomer generation is rapidly aging with fewer children, and the number of elderly people is expected to reach 22 million people in 2025, accounting for more than 30% of the total population (Cabinet Office) White Paper on Aging Society 2022.
Additionally, the number of designated intractable disease patients nationwide is 1,021,606.
(Intractable Disease Medical Research Foundation/Intractable Disease Information Center 2021).
On the other hand, the number of children with specified chronic diseases is reported to be 123,693 (Japan Management Association Research Institute 2022), which is 0.1% of the total population. 54.6% of the population prefers their home as a place of treatment at the end of life (Cabinet Office, 2015).
Given this current situation, home medical care is being promoted.
If the patient is on a remote island or in a depopulated area, it is estimated that medical staff will spend 3 to 4 hours traveling, and doctors or nurses will spend about 15 minutes examining and nursing the patient.
The number of cases that could be examined or cared for in a day was about five.
A doctor or nurse at a collaborative medical care facility in the city uses a non-contact biological monitoring system equipped with a camera at the care patient's home or clinic via wave communication. Visual examinations and non-contact biometric data measurements will be performed using face-to-face images via wave communication, just as in the outpatient examination rooms of core hospitals or clinics.
By observing the patient's health condition from blood pressure, respiratory rate, pulse rate, SPO2, and body temperature, and carefully explaining the symptoms of the disease, we can expect peace of mind and psychological healing from communicating with the patient [1,2].
In addition, the number of patients seen per day is expected to be 40 to 50 or more, and medical fees can be expected to increase.
In addition, the shortage of human resources can be resolved by reducing travel time and transportation costs.
For the daily health management of elderly people living in depopulated, remote areas, or alone, continuous non-contact measurement of vital signs, visual inspection of patient images, and diagnosis of health conditions enables early detection of patient diseases and sudden changes in condition. We developed a future-oriented telemedicine matching system that can quickly provide medical care via wave communication and conducted demonstration tests with the aim of implementing it in society.
Measurement principle
The non-contact biological monitoring device has three built-in sensors and is designed to accurately capture biological information.
This device irradiates the subject with laser light (940 nm Class 1) and the distance to the subject is measured using the Doppler effect method of emitted light, and the pulse wave and respiration are measured.
Wave distance correction was performed [3-7].
Biometric information from a distance of up to 3 meters is irradiated with radar waves in the 24 GHz band. Deriving the weak pulse waves and respiratory waves contained in the emitted waves [8-15]. 24 GHz radar waves emit a wide variety of low-frequency to harmonic waves during spatial propagation. It accurately derives biological information such as pulse waves and respiratory waves even under poor conditions, technology is required.
The maximum heart rate during exercise is approximately 200 bpm to 250 bpm [16,17]. The lowest heart rate risk area is 25 bpm to 40 bpm [18-21], the frequency band is a low - frequency region of 0.04 Hz to 0.45 Hz.
Thermopiles utilize thermoelectromotive force generated by the Seebeck effect.
Figure 1 shows the basics of temperature measurement using a thermocouple.
Figure 1: Basic configuration of thermopile.
In the configuration, the output voltage of the thermocouple is the difference between the hot junction (measurement point) and the cold junction (reference point).
It is proportional to the temperature difference. The thermopile (sensor element) absorbs this extremely small amount of heat.
It is made up of a large number of electrical pairs connected in series (pile) [22].
The light-receiving part of the thermopile is generally coated with gold black, which has no wavelength dependence and responds to light (electromagnetic waves) of any wavelength. However, in reality, depending on the purpose of temperature measurement, a wavelength selection filter is attached to the front of the sensor, and for temperature measurement, a filter that passes through the infrared region is attached to block visible light, thereby eliminating the effects of sunlight and atmospheric moisture. It is decreasing.
The relationship between absolute temperature and infrared wavelength is called Wien's displacement law, and the maximum energy radiation wavelength at that temperature can be easily calculated (1) If the wavelength is λ [μm] and the absolute temperature is T [K], the relationship is expressed by the following formula.
Λ = 2897/T For example, if the body temperature is 37 ℃,
T ≒ 273 137 = 310K, so
λ = 2897/310 ≒ 9.35 μm.
Optical filters commonly used have a bandpass characteristic of approximately 6 to 14 μm, so temperature can be measured well [23].
We will describe the method of calculating blood pressure in units of beats from pulse wave derivation.
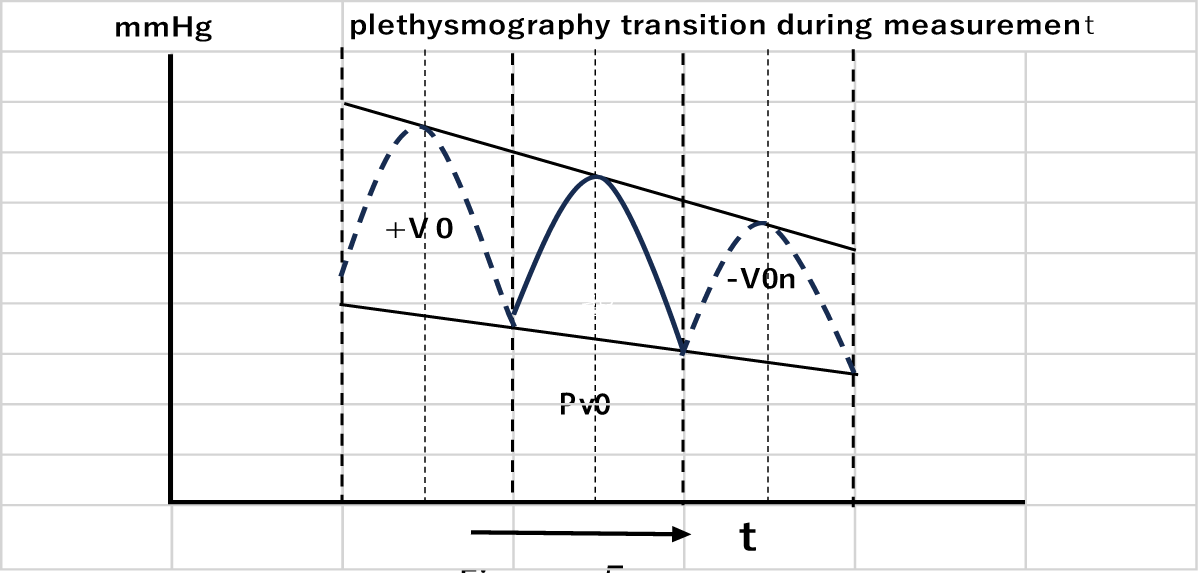
The radar (pyroelectric sensor) 30 in Figure 2 detects a weak cardiac tympanic artery wave emitted by the subject B and generates an amplifier electromotive force Vp1.
The electromotive force Vp1 input to the control section 60 is converted into a plethysmography Pv1 by the calculation section 62.
The actual electromotive force Vp1 when measuring the plethysmography Pv1 changes in value alternately between the positive side and the negative side for each heartbeat in accordance with the heartbeat of subject B in (Figure 1).
Figure 2: Experimental Setup for the Valsalva Test: A detailed diagram showing the setup of equipment and positioning of participants for conducting the Valsalva test.
Subject B's heart rate is the reciprocal of the time t0 required for one heartbeat.
Curve B1 in Figure 3 is a plot of the plethysmography Pv1 determined from the potential difference between the peak and valley of the heartbeat time t0.
Figure 3, a curve B1 is a curve in which the plethysmography Pv1 measured by an experiment is plotted with the horizontal axis as the distance L.
Figure 3: Response Curves to Valsalva maneuver: Depicts the response curves obtained from participants during the Valsalva maneuver, highlighting the physiological changes observed.
As the distance L increases, the detected plethysmography Pv1 gradually attenuates.
Curve B2 is an approximate expression curve created based on curve B1.
The approximation formula is as follows when excluding the effect of attenuation due to distance L, that is, when the distance is 0, the plethysmography Pv1 is the standard volume pulse wave Pv0, and the attenuation rate is the function g(L) of the distance L. It is expressed as (9).
Pv1=Pv0×g(L) (1)
Further, the attenuation rate g(L) is expressed as in equation (2) using Kv as a constant.
g(L)=kv-L (2)
If the standard plethysmography when excluding the influence of attenuation due to distance L is Pv0, then Tc The standard volume pulse wave Pv0 at that time can be calculated using equation (3). Pv0=Pv1×KvL (3) However, when Tc>Tb, the standard plethysmography Pv0 is calculated using equation (4). The coefficient (1.2), which is different from Equation (3), is a coefficient determined from empirical values in order to improve the accuracy of correction. Pv0=Pv1×KvL×1.2 (4) Here, the plethysmography Pv1 is a value calculated from the electromotive force Vp1 of the radar sensor 30, and the distance L is an output value of the distance measuring sensor 40, so both are values calculated or detected by the biological information measuring device 20. Further, the constant Kv is a known value obtained through experiments in advance. Therefore, by executing the correction process of Equation (3) or Equation (4) in the calculation unit 62, it is possible to calculate the standard plethysmography Pv0 excluding the influence of attenuation from the measured value Pv1. On the other hand, the computation unit 62 performs a correction process using the plethysmography Pv1 detected by the radar sensor 30 at the same time as the measurement timing of the pressure pulse wave Pw. Assuming that the standard plethysmography Pv0 is the reference pulse wave, as shown in Figure 4, the integral value of the change in blood flow within the heartbeat time t0 is determined as the reference pulse wave area Vo.
Figure 4: Changes Over Time in the Master Measuring Instrument Results during the Valsalva Test: Illustrates the temporal variations in measurements obtained from the master instrument during the execution of the Valsalva maneuver. Then, the average blood pressure coefficient, the ratio between the systolic blood pressure value and the average blood pressure value, and the ratio between the diastolic blood pressure value and the average blood pressure value are calculated as calibration values according to the following equations (5) to (6). Here, the average blood pressure coefficient is M, the ratio between the systolic blood pressure value and the average blood pressure value is N, and the ratio between the diastolic blood pressure value and the average blood pressure value is O. Furthermore, Pm represents mean blood pressure, Ps represents systolic blood pressure, Pd represents diastolic blood pressure and Vo represents reference pulse wave area. M=V0/Pm (5) N=Ps/Pm (6) O=Pd/Pm (7) As described above, the systolic blood pressure and diastolic blood pressure values measured by the cuff band blood pressure measurement oscillometric method [1,24-27] are based on the standard (M, N, O) from the calibration in Figure 5. After the blood pressure value is determined, the main measurement is performed.
Figure 5: Comparison of Pre and Post-Test Measurements: Shows the comparison between pre-test and post-test measurements, demonstrating the effects of the Valsalva maneuver. Then, the value of the standard volume pulse wave Pv0 obtained through the correction process is input to the calculation unit 62 over time. The calculation unit 62 calculates the pulse wave area Von using the integral value of the input standard volume pulse wave Pv0 over one heartbeat time and calculates the pulse wave area Von from the following equation (8) based on the pulse wave area of one heartbeat and the average blood pressure coefficient M. Average blood pressure per heartbeat Pmn (hereinafter referred to as “one-beat average blood pressure”) is calculated. Pmn=Von/M (8) Further, once the 1-beat average blood pressure has been calculated, the systolic blood pressure slope yS=aX+b and the diastolic blood pressure slope yd=aX+b are calculated from the input systolic blood pressure value and average blood pressure value. Next, the ratio of the pulse wave area V0n of the volume ratio increase/decrease value of the captured volume pulse wave input V0 and the standard volume pulse wave Pv0 to the 1-beat mean blood pressure Pm, and the ratio of the systolic blood pressure value to the systolic blood pressure value and 1 beat. Continuous blood pressure measurement is performed by calculating the maximum blood pressure value Psn and the minimum blood pressure value Pdn from equations (9) and (10) based on the average blood pressure. Shown in Figure 5 [28]. Psm=Pmn×N (9) Pdn=Pmn×O (10)
Evaluation/demonstration test/analysis
For the purpose of social implementation, we conducted a blood pressure correlation experiment while driving in the city using the infrared sensor (IR) and non-contact sensor of the pharmaceutically approved master measuring device (μBP-MP) and the test product (NBC-100).
In addition, nine students conducted a near-miss reproduction experiment using a drive simulator [29-34].
Additionally, nine students conducted a near-miss reproduction experiment using a drive simulator [29-34].
The demonstration experiment was commissioned by the Nagoya Promotion Foundation as part of the Nagoya City Medical and Nursing Care Equipment Advancement Support Project, and was conducted at the “Special Nursing Home Ainosato Nagoya Higashi”.
Target subjects were men and women aged 70 to 88 who required nursing care level 3 or higher, residents with chronic diseases such as dilated gastrostomy, symptomatic epilepsy, hypertension, Alzheimer's dementia, and progressive supranuclear palsy, or whose families had consented. We simultaneously measured the master measuring device (μBP-mp) and test measuring device (NBC1100) on 20 residents and verified the measurement accuracy of vital signs (systolic blood pressure, diastolic blood pressure, respiratory rate, heart rate).
The demonstration evaluation test was conducted in December 2022.
Figure 6 shows a correlation test conducted during city driving to determine whether biological data is affected by vibrations during driving.
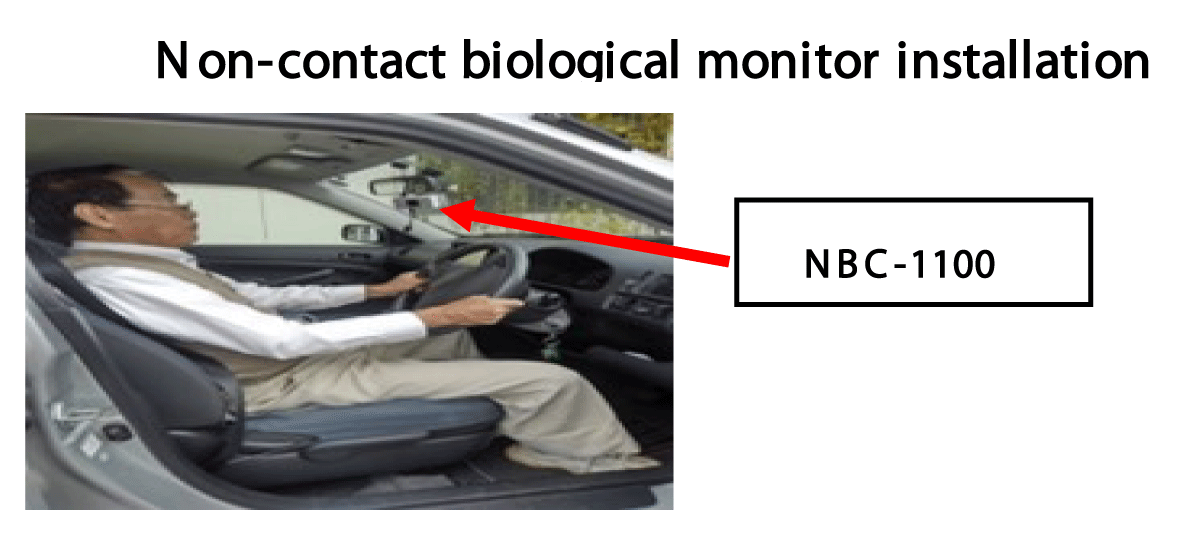
Figure 6: "Non-contact biological monitor in-vehicle setup status and driving status
Table 1 shows the correlation table for 20 minutes of city driving.
| Table 1: Correlation Between In-Vehicle Biological Parameter Measurements | |||||||||||||||||
| Correlation table between master measuring device and test measuring device during in-vehicle operation | |||||||||||||||||
| master me assuring inst rumen (tμBP-mp) | Test measuring instrument (NBC-1100) | Difference between μBP-mp and NBC-1100 | Regression analysis correlation | ||||||||||||||
| Tester | Sensor | Systolic BP (mHg) |
Diastolic BP (mmHg) |
Pulse rate (bpm) |
Breathing rate(bpm) | Systolic BP (mmHg) |
Diastolic BP (mmHg) |
Pulse rate (bpm) |
Breathing rate(bpm) | Systolic BP (mmHg) |
Diastolic BP (mmHg) |
Pulse rate (bpm) |
Breathing rate(bpm) | Systolic BP (mmHg) |
Diastolic BP (mmHg) |
Pulse rate (bpm) |
Breathing rate(bpm) |
| NO | Part | ||||||||||||||||
| 1 | Ear | 133.8 | 85.8 | 69.4 | 11.9 | 137.2 | 89.4 | 62 | 13.7 | 3.4 | 3.6 | 7.4 | 1.8 | 0.99 | 0.992 | 0.977 | 0.978 |
| 2 | Ear | 140.2 | 84.8 | 71.3 | 10.6 | 144.8 | 85.4 | 74.5 | 12.5 | 4.6 | 0.6 | 3.1 | 1.9 | 0.976 | 0.984 | 0.974 | 0.953 |
| 3 | Ear | 139.1 | 80.8 | 70.4 | 12.1 | 131.7 | 73.5 | 68.2 | 12.2 | 7.5 | 7.4 | 2.2 | 0.1 | 0.993 | 0.995 | 0.996 | 0.989 |
| 4 | Ear | 125.4 | 83.3 | 72.1 | 11 | 137.7 | 86.3 | 64.9 | 12.4 | 12.2 | 2.9 | 7.2 | 1.4 | 0.983 | 0.994 | 0.984 | 0.977 |
| 5 | Fingertip | 132.5 | 84.1 | 70.5 | 13.5 | 131.6 | 89.1 | 74 | 13.5 | 0.84 | 5.1 | 3.6 | 2.5 | 0.992 | 0.997 | 0.987 | 0.999 |
| 6 | Fingertip | 119.1 | 79.2 | 72.6 | 12.3 | 124.9 | 78.2 | 64.5 | 14.5 | 5.8 | 0.9 | 8.1 | 2.2 | 0.989 | 0.992 | 0.983 | 0.978 |
| 7 | Fingertip | 124.4 | 81.6 | 71.6 | 16 | 123.5 | 69.2 | 67.1 | 12.7 | 0.9 | 12.4 | 4.6 | 3.2 | 0.993 | 0.989 | 0.982 | 0.8 |
| 8 | Fingertip | 121.7 | 76.7 | 71.2 | 10.3 | 133.5 | 87.2 | 67 | 14.1 | 11.8 | 10.5 | 4.2 | 3.8 | 0.985 | 0.989 | 0.985 | 0.958 |
| 9 | Fingertip | 123.3 | 78.8 | 70.9 | 10.8 | 140 | 87.3 | 67 | 13.9 | 16.7 | 8.5 | 4 | 3.1 | 0.997 | 0.975 | 0.962 | 0.972 |
| Average value | 128.833 | 81.6778 | 71.1111 | 12.0556 | 133.878 | 82.84444 | 67.6889 | 13.2778 | 7.08222 | 5.76667 | 4.93333 | 2.22222 | 0.98867 | 0.989667 | 0.98111 | 0.956 | |
2. Near-miss reproduction experiment using a drive simulator.
At the Arakawa Laboratory of Aichi University of Technology, nine male students conducted a biological reaction experiment using a driving simulator using a non-contact (Laser) sensor to detect a near-miss caused by a car running out of an intersection (Table 2, Figure 7).
| Table 2: Biological Response in Near-Miss Simulation | |||||||
| Near miss reproduction experiment using a drive simulator | |||||||
| Subject | AvHbLe/gdl | AvHbRi/gdl | AvHble3cm/gdl | AvHbRie1cm/gdl | Hbt response/sec | Hbt3bmSD reaction |
Brake response |
| T | 0.03 ± 0.14SD | 0.21 ± 0.1SD | 0.6 ± 0.32SD | 0.39 ± 0.4SD | 5 | -3 | none |
| A | -0.18 ± 0.2SD | -0.9 ± 0.2SD | 0.3 ± 0.14SD | 0.2 ± 0.26SD | -2 | -2 | 3.17 |
| S | 0.36 ± 0.09SD | 0.7 ± 0.16SD | 0.3 ± 0.13SD | -0.4 ± 0.1SD | 0 | 1 | 3.23 |
| T1 | -0.7 ± 0,26SD | 0.1 ± 0.16SD | -0.7 ± 0.14SD | -0.9 ± 0.21SD | 5 | 0 | 3.45 |
| M1 | Not measurable | Not measurable | Not measurable | Not measurable | Not measurable | Not measurable | Not measurable |
| M2 | Not measurable | Not measurable | Not measurable | Not measurable | Not measurable | Not measurable | Not measurable |
| O | Not measurable | Not measurable | Not measurable | Not measurable | Not measurable | Not measurable | Not measurable |
| I | -0.14 ± 0.17SD |
0.14 ± 0.1SD | -0.11 ± 0.1SD | -0.2 ± 0.2SD | -12,00 | -10 | none |
| K | Not measurable | Not measurable | Not measurable | Not measurable | Not measurable | Not measurable | Not measurable |
| Average | -0. ± 0.17SD | 0.05 ± 0.1SD | 0.08 ± 0.17SD | -0.18 ± 0.23SD | -0.8 | -2.8 | 3.3 |
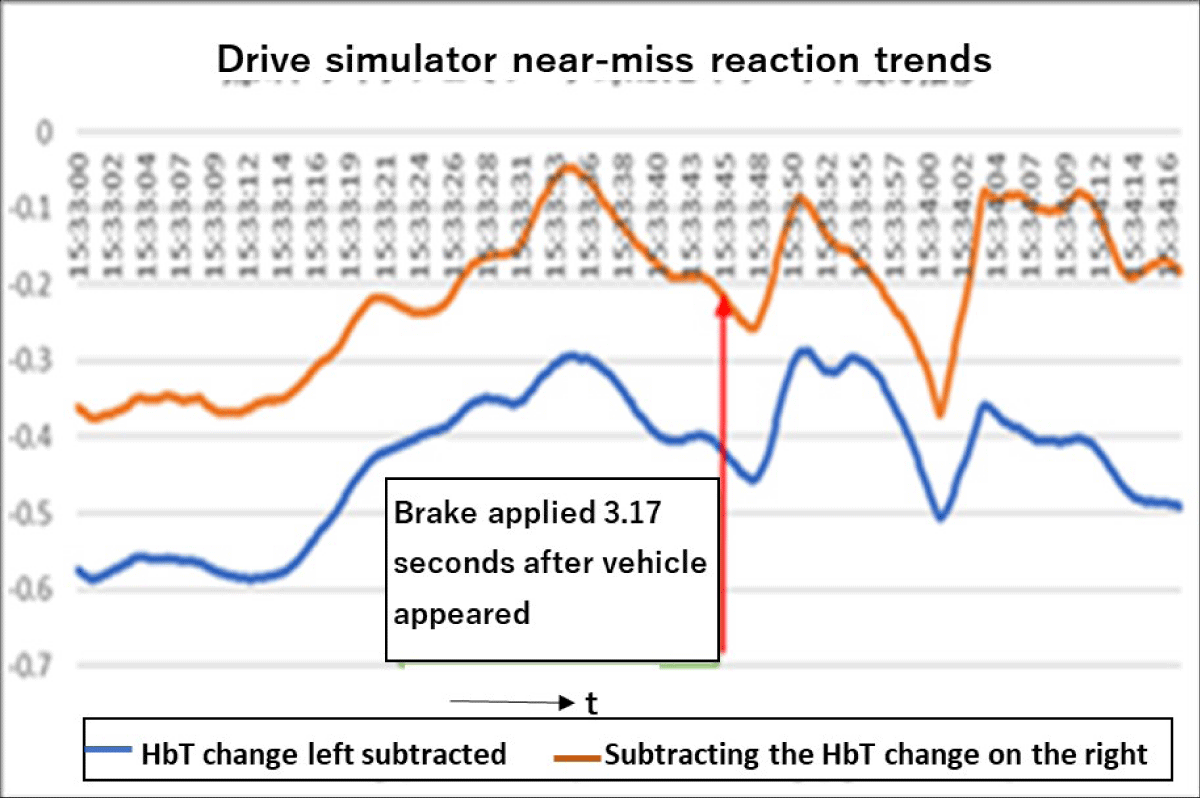
Figure 7: Inter-participant Variability in Test Results: Graphical representation of the variability in test results across different participants, emphasizing individual differences.
Table 2 shows Hbt measurement data and brake response measurement data at the time of vehicle appearance in a near-miss biological reaction experiment due to running out of an intersection using a drive- simulator.
Figure 7 shows the time course of Hbt response and brake response when a vehicle appears.
3. Valsalva test (autonomic nerve function testing method)
A mock test using the Valsalva test was conducted to check whether the test measuring device (NBC- 1100) could respond to sudden changes in physical condition.
Figure 8 shows the temporal changes in the Hbt response and brake response when a vehicle appears.
Figure 8 shows the changes in blood pressure measured simultaneously using the pharmaceutically approved product µBp-mp and the non-contact biological monitor NBC-1100 during the Valsalva test. The non-contact biological monitoring device NBC-1100 undergoes 10-beat moving average processing to capture the measurement data stably, as slight body movements occur during breath holding.
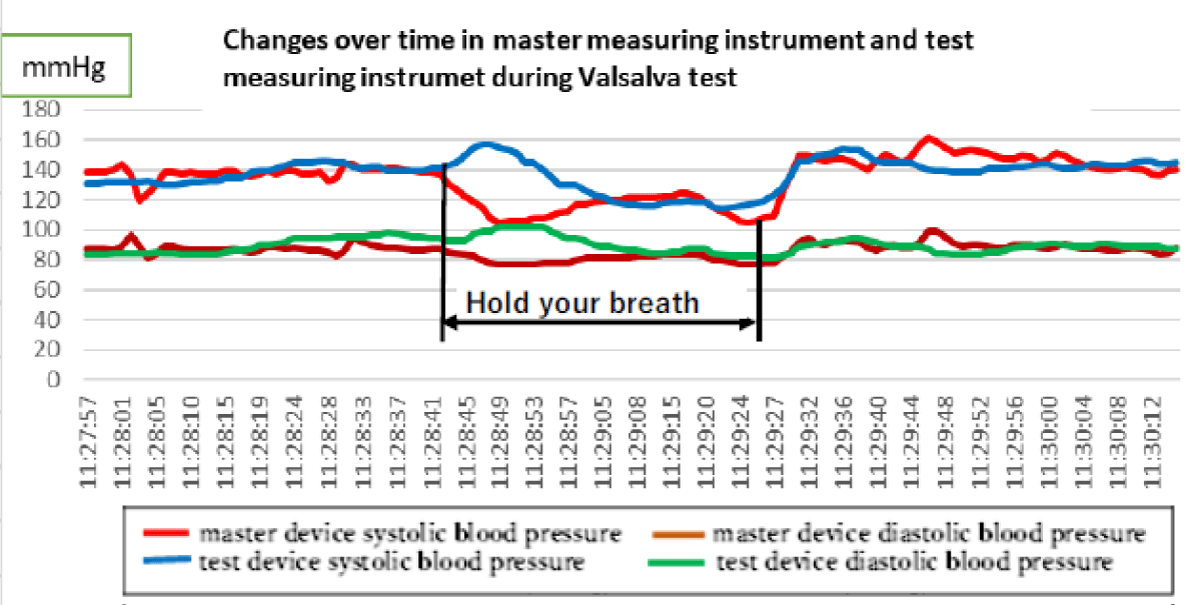
Figure 8: Correlation Between Measurement Instruments: Illustrates the correlation between data collected from the master measuring instrument and other assessment tools used in the study.
Therefore, NBC-1100 systolic blood pressure (blue) is delayed when breath holding decreases compared to μBP-mp systolic blood pressure (red). Table 3 shows the measurement data.
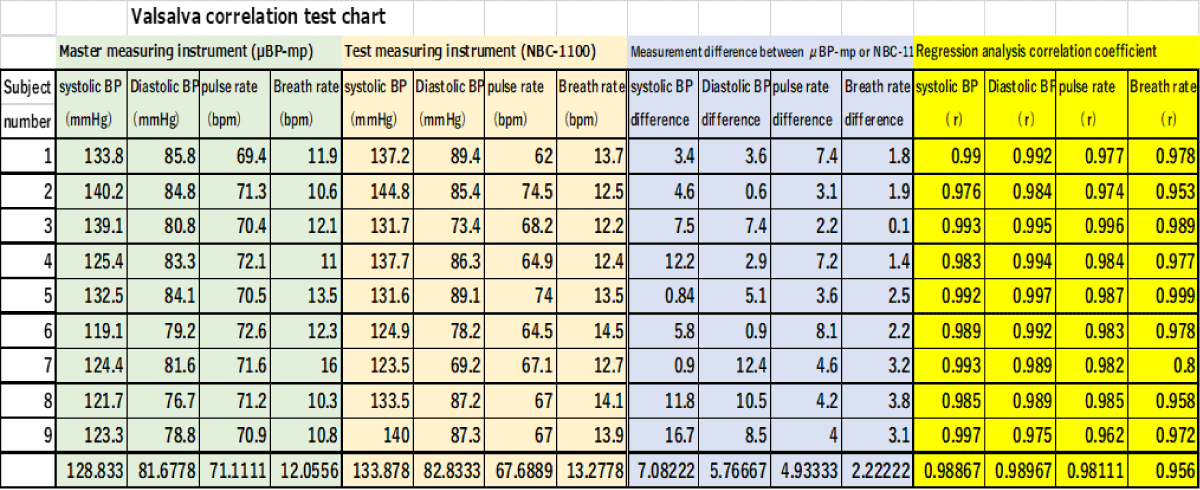
Table 3: Valsalva Maneuver Test Results.
(1) Table 4 shows a demonstration test conducted in a medical facility's recuperation ward with 10 people, 4 men, and 6 women, ages 75 to 94, with the consent of the residents themselves or their families.
| Table 4: Measurement Accuracy in Medical Facility Recuperation Ward. | ||||||||||||||
| Nursing ward patient correlation test table | ||||||||||||||
| Master measuring (μBP-mp) | Test measuring (NBC-1100) | Measurement di difference μBP-mp and NBC-1100 | regression analysis | |||||||||||
| Subject | Systolic BP (mmHg) |
Diastolic BP (mmHg) |
Pulse rate (bpm) |
Systolic BP (mmHg) |
Diastolic BP (mmHg) |
Pulse rate (bpm) |
Systolic BP difference | Diastolic BP difference | Pulse rate difference | Systolic BP (r) |
Diastolic BP (r) |
Pulse rate (r) |
||
| number | gender | age | ||||||||||||
| 1 | male | 86 | 98.1 | 51.4 | 72.8 | 94.2 | 51.8 | 69.8 | 3.9 | 0.4 | 3 | 0.993 | 0.996 | 0.983 |
| 2 | woman | 90 | 139.1 | 74.8 | 72.1 | 137.2 | 71.9 | 75.5 | 1.9 | 2.9 | 3.4 | 0.991 | 0.957 | 0.985 |
| 3 | woman | 91 | 124.1 | 71.9 | 96.1 | 128.3 | 70.3 | 86.9 | 4.2 | 1.6 | 9.2 | 0.995 | 0.999 | 0.996 |
| 4 | woman | 92 | 103.2 | 58.7 | 76.7 | 105.2 | 58.2 | 78.7 | 2 | 0.5 | 2 | 0.998 | 0.999 | 0.996 |
| 5 | woman | 93 | 115.7 | 67.7 | 61.3 | 116.8 | 68.1 | 66.5 | 1.1 | 0.4 | 5.2 | 0.999 | 0.999 | 0.994 |
| 6 | woman | 94 | 137.3 | 67.5 | 74.6 | 137 | 66.1 | 77.8 | 0.3 | 1.4 | 3.2 | 0.998 | 0.998 | 0.991 |
| 7 | woman | 95 | 122.4 | 57.5 | 71.3 | 119.6 | 57.2 | 75.9 | 2.8 | 0.5 | 4.6 | 0.997 | 0.999 | 0.99 |
| 8 | woman | 96 | 178.1 | 92.1 | 61.5 | 177.3 | 90.7 | 71.9 | 0.8 | 1.4 | 10.4 | 0.999 | 0.999 | 0.999 |
| 9 | woman | 97 | 79.3 | 47.2 | 67.9 | 79.5 | 44.2 | 77.4 | 0.2 | 3 | 9.5 | 0.999 | 0.999 | 0.992 |
| 10 | male | 94 | 119.2 | 68.3 | 96.4 | 123.1 | 69.7 | 92 | 3.9 | 1.4 | 4.4 | 0.995 | 0.998 | 0.996 |
| average age | 93 | 121.65 | 65.71 | 75.07 | 121.82 | 64.82 | 77.24 | 2.11 | 1.35 | 5.49 | 0.9964 | 0.9943 | 0.9922 | |
(2) A demonstration experiment was conducted at Ainosato Nagoya Higashi, a special nursing home for the elderly.
Twenty men and women between the ages of 70 and 88 with level 3 or higher levels of nursing care participated.
This was done with the consent of the resident or his or her family.
The tests were conducted on residents with chronic diseases such as gastrostomy expansion, symptomatic epilepsy, hypertension, Alzheimer's disease, and progressive supranuclear palsy. Evaluation was performed by simultaneous measurement using a master measuring device (μBp- mp) and an inspection and measuring device (NBC-1100).
The test method was performed using the following three methods.
A. Post-meal relaxation time (1 hour) 3 men, 2 women, average age 73 years old
B. Sleep time (2 hours) 7 women, average age 80 years old
C. Activity time (2 hours) 7 women, average age 78 years old
A. Relaxation time after meals
Table 5 shows that the subjects were in a non-REM sleep state for about 30 minutes, and then continuous measurements were taken for 30 minutes.
An evaluation test was conducted using simultaneous measurements using a master measuring device (μBP-mp) and a test measuring device (NBC-1100).
| Table 5: Post-Meal Relaxation Period Measurements in Nursing Care Facility. | |||||||||||||||
| Post-meal relaxation correlation test table | |||||||||||||||
| Master measurement device (μBP-mp) | Test measuring device (NBC-1100) | μBP-mp a d NBC-1100 measurement difference | Regression analysis | ||||||||||||
| subject | Systolic BP (mmHg) |
Systolic BP (mmHg) |
Systolic BP (mmHg) |
Breathing rate (bpm) |
Systolic BP (mmHg) |
Systolic BP (mmHg) |
Systolic BP (bpm) |
Breathing rate (bpm) |
Systolic BP (mmHg) |
Systolic BP (mmHg) |
Systolic BP (bpm) |
Breathing rate (bpm) |
Correlation coefficient(r) | Significance Level (%) |
|
| gender | age | ||||||||||||||
| male | 74 | 111.4 | 55.2 | 74.2 | --- | 119.3 | 54.9 | 62.8 | --- | 7.9 | 0.3 | 11.4 | --- | 0.998 | 3 |
| male | 75 | 108.2 | 56.7 | 69.4 | --- | 100.6 | 53.9 | 69 | --- | 7.7 | 2.7 | 5.1 | --- | 0.996 | 4 |
| woman | 72 | 122.3 | 82.4 | 74 | --- | 127.1 | 76.5 | 70.5 | --- | 3.5 | 2.4 | 5.5 | --- | 0.994 | 6 |
| woman | 72 | 93 | 50.1 | 63.7 | 13.7 | 100.5 | 56.5 | 59.3 | 14 | -7.4 | -6.3 | 4.4 | -0.3 | 0.996 | 8 |
| male | 74 | 112.1 | 53.7 | 56.5 | 13.4 | 110.6 | 50.7 | 58.7 | 12.4 | 1.5 | 3 | -2.2 | 1 | 0.986 | 8 |
| average | 73.4 | 109.4 | 59.62 | 67.56 | 13.55 | 111.62 | 58.5 | 64.06 | 13.2 | 2.64 | 0.42 | 4.84 | 0.35 | 0.994 | 5.8 |
B. Sleeping time
Table 6 shows continuous measurement for 2 hours during REM sleep.
The evaluation test table is shown by simultaneous measurements using the master measuring instrument (μBP-mp) and the test measuring instrument (NBC-1100).
However, the time of temperature measurement or diaper changing time was excluded.
| Table 6: Continuous Measurement During Sleep. | |||||||||||||||
| Activity time period correlation table | |||||||||||||||
| Master measuring (μBP-mp) | Test measuring (NBC-1100) | Measurement di difference μBP-mp and NBC-1100 | regression analysis | ||||||||||||
| Systolic BP | Diastolic BP | Pulse rate | breathing rate | Systolic BP | Diastolic BP | Pulse rate | breathing rate | Systolic BP | Diastolic BP | Pulse rate | breathing rate | correlation | Significance | ||
| gender | age | (mmHg) | (mmHg) | (bpm) | (bpm) | (mmHg) | (mmHg) | (bpm) | (bpm) | difference | difference | difference | difference | coefficient | level (%) |
| woman | 88 | 115.9 | 49.9 | 56.3 | 13.7 | 113.7 | 50 | 64.3 | 13.6 | 2.2 | -0.1 | -0.6 | 0.1 | 0.99 | 2.5 |
| woman | 70 | 126.7 | 82.6 | 61.3 | 16.7 | 131.3 | 81.8 | 60 | 16.4 | -3.6 | 5.1 | -0.5 | 1 | 0.997 | 3 |
| woman | 79 | 125.1 | 78 | 67.8 | 13.8 | 125 | 82.3 | 68.7 | 14.5 | 0.1 | -4.3 | -0.9 | -0.7 | 0.996 | 4 |
| woman | 81 | 122.1 | 67.4 | 69.2 | 17.1 | 122.4 | 76.7 | 66.7 | 15 | -0.3 | -0.2 | 2.5 | 2.1 | 0.996 | 2.8 |
| woman | 83 | 112.1 | 53.7 | 56.5 | 13.4 | 110.6 | 50.7 | 58.6 | 12.4 | 1.5 | 3 | -2.2 | 1 | 0.991 | 4.5 |
| woman | 81 | 124.1 | 56.3 | 86 | 16.4 | 122.7 | 55.8 | 85.7 | 14.9 | 1.4 | 0.5 | 0.3 | 1.4 | 0.996 | 3.5 |
| woman | 79 | 108.2 | 56.7 | 69.4 | --- | 100.1 | 56.7 | 59 | --- | 7.7 | 2.7 | 0.4 | --- | 0.996 | 4.3 |
| aveg | 80.1 | 119.171 | 63.5143 | 66.643 | 15.18333 | 117.971 | 64.8571 | 66.1429 | 14.46667 | 1.28571 | 0.95714 | -0.1429 | 0.816667 | 0.99457 | 3.51429 |
C. Activity hours
Table 7 shows continuous measurement for 2 hours during active hours.
The evaluation test table is shown by simultaneous measurements using the master measuring instrument (μBP-mp) and the test measuring instrument (NBC-1100).
| Table 7: Longitudinal Study Results: This table presents a longitudinal analysis of study data and shows trends and patterns over the study period. | |||||||||||||||
| Activity time period correlation table | |||||||||||||||
| Master measuring (μBP-mp) | Test measuring (NBC-1100) | Measurement difference μBPmp and NBC-1100 | regression analysis | ||||||||||||
| Systolic BP | Diastolic BP | Pulse rate | breathing rate | Systolic BP | Diastolic BP | Pulse rate | breathing rate | Systolic BP | Diastolic BP | Pulse rate | breathing rate | correlation | Significance | ||
| gender | age | (mmHg) | (mmHg) | (bpm) | (bpm) | (mmHg) | (mmHg) | (bpm) | (bpm) | difference | difference | difference | difference | coefficient | level (%) |
| woman | 79 | 110.9 | 48.8 | 63.5 | 12.6 | 110.8 | 55.3 | 60.3 | 13.3 | 0.04 | -4.6 | 3.1 | 0.7 | 0.995 | 5.3 |
| woman | 83 | 109.4 | 51.9 | 59 | 14.5 | 116.1 | 57.7 | 62.6 | 13.7 | -6.7 | -5.8 | -3.6 | 0.7 | 0.974 | 7 |
| woman | 88 | 141.8 | 80.9 | 55.3 | 13.7 | 138.1 | 84.7 | 47.2 | 14 | 3.6 | -3.8 | 8.1 | -0.3 | 0.991 | 6.5 |
| woman | 81 | 108.2 | 56.7 | 71.8 | --- | 100.6 | 53.9 | 60.1 | --- | 7.7 | 2.7 | 11.7 | --- | 0.995 | 10.3 |
| woman | 70 | 99.5 | 51.7 | 57.6 | 13.9 | 103.8 | 63.3 | 60 | 14.4 | -4.3 | 11.6 | 3.4 | -0.5 | 0.993 | 8.3 |
| woman | 72 | 99.5 | 51.7 | 57.6 | 13.9 | 114.5 | 68.6 | 59 | 12.5 | -3.9 | -8.5 | 6.2 | 0.08 | 0.968 | 6.8 |
| woman | 70 | 166 | 55.6 | 61 | 13.5 | 138 | 62.3 | 59.8 | 13.8 | -16.4 | -6.7 | 1.1 | -0.3 | 0.995 | 21 |
| woman | 81 | 117.9 | 56.8 | 51 | 11.2 | 115.1 | 55.1 | 60.2 | 12.8 | 2.7 | 1.4 | -9.2 | -1.6 | 0.984 | 14.3 |
| aveg | 78 | 119.15 | 56.763 | 59.6 | 13.32857 | 117.41 | 62.6125 | 58.65 | 13.5 | -2.1575 | -1.713 | 2.6 | -0.17429 | 0.98688 | 9.9375 |
Analysis method
The master instrument (μBP-mp) and test instrument (NBC-1100) averaged the number of measurements per beat of systolic blood pressure, diastolic blood pressure, pulse rate, and respiratory rate. Further, the master measuring device and the test measuring device were subjected to 10-beat fluctuation averaging processing, and statistical analysis was performed using a regression analysis method.
Measurement result
1. The evaluation results of simultaneous measurements during city driving using the master measuring device (μBP-mp) and test measuring device (NBC-1100) are as follows.
The mean systolic blood pressure value on the master meter was 128.8 mmHg, the mean diastolic blood pressure value was 81.1 mmHg, the mean pulse rate was 71.1 bpm, and the mean respiratory rate was 12.1 bpm.
The average correlation coefficient of statistical regression analysis was r = 0.997, and the average significance level was suggested to be within 5.0%.
2. The evaluation results of a near-miss reproduction experiment using a drive simulator are as follows.
At the Arakawa Laboratory at Aichi University of Technology, nine male students used a non-contact (laser) sensor to evaluate biological reactions in a near miss caused by running out of a car at an intersection in a driving simulator.
The average value of HbLe/gdl is -0.1 ± 0.17SD, the average value of HbRi/gdl is 0.05 ± 0.2SD, and the average value of Hble3cm/gdl is 0.02 ± 0.17SD, mean HbRi1cm/gdl value -0.18 ± 0.2SD, mean Hbt response 0.8 seconds, mean Hbt3cmSD response suggested -2.8 seconds, mean -K response 3.3 seconds.
Additionally, four of the nine people encountered oncoming vehicles at the intersection and passed through the intersection without applying the brakes.
3. The Valsalva test will be tested on nine healthy men with an average age of 50 to verify their adaptability to sudden changes in condition and measurement accuracy.
Simultaneous measurements were performed using a master measuring instrument (μBP-mp) and a test measuring instrument (NBC-1100) [35-37].
The average systolic blood pressure value of the master meter is 128.8 mmHg, the average diastolic blood pressure value is 81.7 mmHg, the average pulse rate is 71.1 bpm, the average respiratory rate is 12.1 bpm, and the average systolic blood pressure value of the test meter is the mean diastolic blood pressure was 133.9 mmHg, the mean diastolic blood pressure was 82.3 mmHg, the mean pulse rate was 67.7 bpm, and the mean respiratory rate was 13.3 bpm.
The average pressure difference between the master device and the test device was 7.1 mmHg, the average diastolic blood pressure difference was 5.8 mmHg, the average pulse rate was 4.9 bpm, and the average respiratory rate difference was 2.2 bpm.
Statistical regression analysis suggested mean systolic blood pressure correlation number r = 0.986, mean diastolic blood pressure correlation number r = 0.99, mean pulse rate r = 0.981, and mean respiratory rate correlation number r = 0,957.
In addition, in a mock test, the test device (NBC-1100) suggested that it was possible to track the sudden drop in blood pressure and the transition to recovery.
4. Demonstration test by medical facilities and nursing care facilities
(1) A demonstration test was conducted in a treatment ward of a certain medical facility with 10 people, 4 men and 6 women, ages 75 to 94, with consent from the residents themselves or their families.
Demonstration test was conducted with simultaneous measurement using a master measuring instrument (μBP-mp) and a test measuring instrument (NBC-1100).
The master device's mean systolic blood pressure is 121.7 mmHg, mean diastolic blood pressure is 75.1 mmHg, and mean pulse rate is 75.1 bpm and the test device's mean systolic blood pressure is 121.8 mmHg, mean diastolic blood pressure is 64.8 mmHg, and mean pulse rate is 77.2 bpm.
The average systolic blood pressure difference between the master device and the test device was 2.1 mmHg, the average diastolic blood pressure difference was 1.4 mmHg, and the average pulse rate difference was 5.5 bpm.
Statistical regression analysis suggested a mean systolic blood pressure correlation coefficient r = 0.996, a mean diastolic blood pressure correlation coefficient r = 0.994, and a mean pulse rate correlation coefficient r = 0,992 between the master and test device.
(2) A demonstration test was conducted at Ainosato Nagoya Higashi, a special nursing home for the elderly, with 20 male and female residents aged 70 to 88 with care level 3 or higher, who had the consent of the residents themselves or their families.
The tests were conducted on residents with chronic diseases such as gastrostomy expansion, symptomatic epilepsy, hypertension, Alzheimer's disease, and progressive supranuclear palsy.
Simultaneous measurements were performed using a master measuring instrument (μBP-mp) and a test measuring instrument (NBC-1100).
The test method was performed using the following three methods.
A. Measurement during post-meal relaxation time (continuous measurement for 1 hour) 3 men, 2 women, average age 73 years old
B. Sleep time measurement (2 hours continuous measurement) 7 women, average age 80 years old
C. Activity time measurement (2 hours continuous measurement) 7 women, average age 78 years old
A. During the postprandial relaxation period, the average systolic blood pressure value on the master device was 109.4 mmHg, the average diastolic blood pressure value was 59.6 mmHg, the average pulse rate was 67.6 bpm, and the average respiratory rate was 13.6 bpm. The test device had an average systolic blood pressure value of 111.6 mmHg, an average diastolic blood pressure value of 58.5 mmHg, an average pulse rate of 64.1 bpm, and an average respiratory rate of 13.2 bpm.
Furthermore, the average systolic blood pressure difference was 2.6 mmHg, the average diastolic blood pressure difference was 0.42 mmHg, the average pulse rate difference was 4.84 bpm, and the average respiratory rate difference was 0.35 bpm.
Statistical regression analysis showed that the correlation coefficient between mean systolic blood pressure, mean diastolic blood pressure, mean pulse rate, and mean respiration rate was r=0.99 or higher. The average significance level was suggested to be 5.8%.
B. During the sleep period, the master device had a mean systolic blood pressure of 119.2 mmHg, a mean diastolic blood pressure of 63.5 mmHg, a mean pulse rate of 66.6 bpm, and a mean respiratory rate of 15.2 bpm, while the master device had a mean systolic blood pressure 118.0mmHg, mean diastolic blood pressure value was 64.9 mmHg, mean pulse rate was 66.1 bpm, and mean respiratory rate was 14.5 bpm.
Furthermore, the average systolic blood pressure difference was 1.3 mmHg, the average diastolic blood pressure difference was 1.0 mmHg, the average pulse rate difference was -0.14 bpm, and the average respiratory rate difference was 1.05 bpm.
The correlation between the average systolic blood pressure, diastolic blood pressure correlation coefficient, average pulse rate, and average respiratory rate in statistical regression analysis is r=0.995. The average significance level suggested 3.5%.
C. During the active period, the master device had a mean systolic blood pressure value of 119.2 mmHg, a mean diastolic blood pressure value of 56.8 mmHg, a mean pulse rate of 59.6 bpm, and a mean respiratory rate of 13.1 bpm. The average systolic blood pressure on the test device was 117.1 mmHg, the average diastolic blood pressure was 62.6 mmHg, the average pulse rate was 58.7 bpm, and the average respiratory rate was 13.5 bpm.
Furthermore, the average systolic blood pressure difference was -2.2 mmHg, the average diastolic blood pressure difference was -1.7 mmHg, the average pulse rate difference was 2.6 bpm, and the average respiratory rate difference was -0.2 bpm.
The correlation between the average systolic blood pressure, diastolic blood pressure correlation coefficient, average pulse rate, and average respiratory rate in statistical regression analysis is r=0.99 or higher. The average significance level was suggested to be 9.9%.
For the purpose of social implementation, we verified whether in-vehicle vibration during city driving would cause errors in biological parameter measurements.
The verification results suggested that the measurement difference between the master measuring device (μBP-mp) and the test measuring device (NBC-1100) was within the pharmaceutical certification standards.
In addition, in a near-miss biological reaction test using a driving simulator, four subjects ignored oncoming vehicles and did not avoid collisions.
The biological reactions of the other five people suggested an average Hbt response of 0.8 seconds, an average Hbt3cmSD response of 2.8 seconds, and an average brake response of 3.3 seconds. Next, we verified that the test measuring device (NBC-1100) can track sudden changes in the condition of patients in medical facilities, nursing care facilities, and home care after a 10-beat delay with the master (μBP-mp).
The verification test results at medical facilities and nursing care facilities are based on the comparison of biological parameters measured simultaneously with the master measuring device μ BP-mp and the test measuring device (NBC-1100).
As a result of conducting evaluation tests in 3 patterns: 1. Relaxation time after meals, 2. Sleep time and 3. Activity time.
During the postprandial relaxation time and sleep time, blood pressure, heart rate, and breathing rate all showed a high correlation, confirming measurement accuracy comparable to that of conventional medical equipment.
Next, the results during active hours suggested that the reproducibility of the pulse wave decreased due to the scattering of radar waves due to the caregiver leaving the bed and the movement of surrounding people, and the average significance level was low at 9.9%.
Suggested that the reproducibility of plethysmography will improve in the future.
In conclusion, our study shows that in-vehicle vibration during city driving does not affect biological parameter monitoring. NBC-1100 outperformed BP-mp in detecting sudden changes in patients' conditions with a 10-beat delay. Assessment tests showed a high correlation between biological markers during post-meal relaxation and sleep, suggesting medical-grade accuracy. However, radar wave scattering affected pulse wave repeatability during active hours. Technology should increase repeatability in the future. In-vehicle medical monitoring systems are better understood and developed after these findings.
Gratitude
We would like to thank the Nagoya City Industrial Promotion Corporation, the Ainosato Special Nursing Home, the Medical Corporation Nieikai Nyuzen Central Hospital, Dr. Sato, the chairman of the board, and all the staff for their efforts in the demonstration experiment.
- Yamamoto M, Iwamoto J. Research on the differences in blood pressure measurement using an oscillometric automatic blood pressure monitor and a mercury blood pressure monitor. Journal of the Japanese Society of Nursing Technology. 2008; 7: 20.
- Medical Device Center (Foundation): Basic knowledge of medical devices, 2nd edition: 2008: Related to biological phenomenon measurement and monitoring systems, blood pressure monitors and blood pressure monitors
- Koshirai R. Aerial Laser Surveyor: 2004: Geospatial Information Authority of Japan Technical Data H. 1-No.4
- Sato M, Kawaguchi T. Development of a simple functional reach test using a laser rangefinder: 2021: Aomori Health, Medical and Welfare Research 3 (2): 35-40
- Iwasa I, Nasu K, Soeda M, Yamamoto K. Understanding the state of stray actual behavior using 3D laser sensors: Architectural Institute of Japan Technical Report. 2020; 26: 239-24.
- Matsumoto H, Fujima I. Measuring long distances with lasers. Measurement and Control. 1992; 31.
- Takahashi R, Tsutsui T, Kashiwagi Y, Funato K. Evaluation method for short-distance sprinting ability using a laser Doppler distance measurement device - Comparison of university softball players and short-distance track and field athletes - Nippon Sport Science University Bulletin of Nippon Sport Sci. Univ. 2013; 42(2): 103–110.
- David MP. Microwave Engineering: 2021: ISBN978-4-627-78644-8
- Matsumura T. Principles of Microwave Chemistry - Microwave Electric Field and Dielectric Properties of Materials. Chemistry and Education. 2006; 54.
- Mase J, Tobimatsu S, Hojo H, Chikagi Y. Biological measurement using microwave active sensors and its applications: Society of Instrument and Control Engineers. 2011; 50: 233-242.
- Mase J, Tobimatsu S, Hojo H, Chikagi Y: Development of advanced microwave living body detection system. Japanese Journal of Applied Physics. 2008; 47: 4755-4758.
- Honma N, Nishimori K. Research on biological activity detection method using microwaves to realize health monitoring system: Telecommunications Promotion Foundation Research Survey Report. 2013.
- Eong-suk K. Biological signal measurement using microwaves and millimeter waves: 2018: Institute of Electronics, Information and Communication Engineers IEICE technical report. MICT2017-55
- Iwata J, Tanaka Y, Sakamoto T. Study on the measurable distance of biological signals using millimeter wave radar: Electronic Information and Communication Technical Report. 2023; 123; 249- 254.
- Sakamoto T. Human body sensing using millimeter wave radar: Transactions of the Institute of Electronics, Information and Communication Engineers. 412-420.
- Arakawa T. A Review of Heartbeat Detection Systems for Automotive Applications: International Sensors. 2021; 21: 6112
- Arakawa T, Sakakibara N, Kondo S. Development of non-invasive steering-type blood pressure sensor for driver state detection. ICIC International. 2018. ISSN 1349-4198 pp. 1–1712-035
- Temperature can be measured in a short time without contact, regardless of distance! Application of thermopile. Design and production of non-contact temperature sensor for experiment: 2021: SSC Co., Ltd.
- Tanaka K, Yoshimura T. Is heart rate prescription recommended for aerobic exercise?. Physical Fitness Science. 2020; 69: 285-288 DOI: 10.7600/jspfsm.69.285
- Yamaji K. Exercise and heart rate: 2001: Lecture at the 55th Japanese Society of Physical Fitness Medicine. Physical Fitness Science. 2001; 50: 1-6.
- D'Souza A, Bucchi A, Johnsen AB, Jit S, Logansa RJ, Monfredi O, Yani J, Prehar S, Hart G, Cartwright E, Wislov U, Dobriznsky H, DiFrancesco D, Morris GM, Boyett MR. Cardiology. Why people who exercise regularly have low heart rates: Nature Communications. 2014.
- SSC (Co., Ltd.): Temperature can be measured in a short time without contact, regardless of distance! Application of thermopile, 2021: Design and production of non-contact temperature sensor for experiment.
- Nakamura H. Basics of infrared radiation thermometers: 2009: Japan Society of Mechanical Engineers Thermal Engineering Division Seminar.
- Takada M, Tsuneda T, Shimakura J, Laozi Y, Inado S, Ohara M, Kinuno H. Current status and issues of oscillometric automatic blood pressure monitors: General Health Checkup. 2015; 42.
- Yamamoto M, Iwamoto J. Research on the difference in blood pressure measurement using an oscillometric automatic blood pressure monitor and a mercury blood pressure monitor: Journal of the Japanese Society of Nursing Technology. 2008; 7.
- Okubo T, Tatsumi Y, Asayama T. Review (Circulatory disease health checkup techniques and criteria.
- Okubo T, Tatsumi Y, Asayama K. Review (Circulatory disease health checkup techniques and criteria ③) Blood pressure measurement method: Journal of the Japanese Society for Cardiovascular Disease Prevention. 2021; 56.
- Kondo S. Biological information measuring device: 2021: Patent No. 6941720
- Arakawa T, Sakakibara N, Kondo H. Development of an infrared non-contact continuous blood pressure monitor and attempt to detect change points based on statistical methods: Biomedical Engineering Symposium. 2019.
- Arakawa T, Tanaka M,Obayashi F, Kondo S. Detection of Driver’s Surprised State Based on Blood Pressure. ICIC International. 2012; 1–6.
- Tanakaa M,Obaytthia F,Arakawaa T,Kondo S, Kozuka K. Detection of Driver's Surprised State BaSed on Blood Pressure and Consideration about Sensitivity of Surprised. CISIP2014:
- Tanakaa M,Arakawa T, Obayashi F, Kondo S,Kozuka K. Detection of Driver’s Surprised State Based on Blood Pressure; ICIC International. 2012.
- Tanakaa M,Sakakibara N,Kondo S. Development and Evaluation of Infrared Blood Pressure Monitoring System and Proposal for Driver State Monitoring Human Machine Interface. Submitted to Sensors. 2020; 1–1.
- Tanakaa M,Sakakibara N,Kondo S. Development of a Portable Infrared-type Noncontact Blood Pressure Measuring Device and Evaluation of Blood Pressure Elevation during Driving. Springer Science+Business Media, LLC, part of Springer Nature 2020 M Sawan (ed.), Handbook of Biochips. 2020.
- Maeda Y, Sekine M, Tamura T, Mizutani K. Estimating autonomic nerve function using pulse waves Verification of variation in pulse wave propagation time. Biomedical Engineering. 2016; 54 (6) 261-266.
- Tanaka K, Yoshimura T. Is heart rate prescription recommended for oxygenated exercise?. Physical Fitness Science. 2020; 69: 285-288. DOI: 10.7600/jspfsm.69.285
- Onuda T, Kasao M, Ono T, Mitsui K, Shibata J. Measuring method of variability of ventricular repolarization time (STV-QT) - On the optimal minimum heart rate. JPN. J Electrocardiology. 2014; 34.